Approach 1:
In our experiment, we took images of four, different sized red papers at distances between 4 and 13 feet, and registered their pixel wise area.
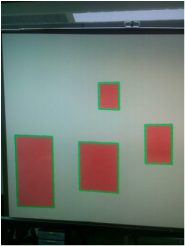
Figure 1: Measurement setup
After acquiring the data for each input size, we fitted a decaying exponential of the form dist=a*e^(pix_are*t)+b. We chose this function after experimenting with other forms, because it produced the best results. Using this function we are able to predict the distance of a known object by measuring its pixel wise area.
To generalize for any arbitrary sized object, we used our existing measurements to interpolate new points. We approximated the pixel area occupied by the new object at every measurement distance by fitting a 45 degree line (which again, proved to be sufficient through experiment) on the four measurement points at each distance (figure 5). This line is then used to assign pixel area to out new arbitrary sized object. After that, the decaying exponential is fitted the same way as before on our new points.
To generalize for any arbitrary sized object, we used our existing measurements to interpolate new points. We approximated the pixel area occupied by the new object at every measurement distance by fitting a 45 degree line (which again, proved to be sufficient through experiment) on the four measurement points at each distance (figure 5). This line is then used to assign pixel area to out new arbitrary sized object. After that, the decaying exponential is fitted the same way as before on our new points.
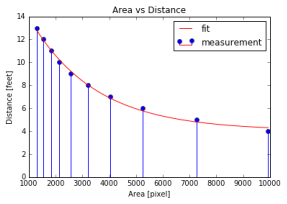
Figure 2: Pixel area measurements at different distances for a fixed size |
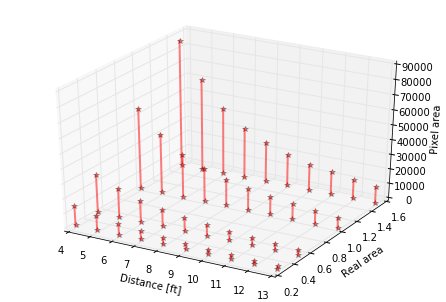
Figure 3: Pixel area measurements at different distances, 4 different sized object |
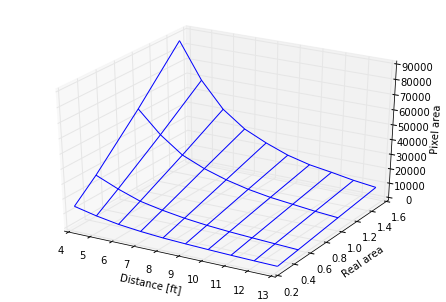
Figure 4: Mesh grid fitted on measured date |
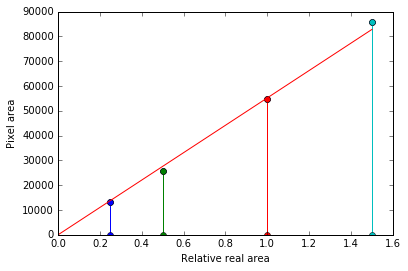
Figure 5: Measured distances vs real area at 4 feet, line for interpolation |
Approach 2:
Using a similar test pattern as Approach 1, we took images at 5, 8, 11, and 14 feet. Our prediction for the test pattern at 8 feet was dead on. At 5 feet, the prediction was accurate to within half a foot (4.6 feet). At 11 feet, our prediction was accurate to within 1.5 feet (9.6 feet). Beyond 11 feet, distance predictions were unreliable.
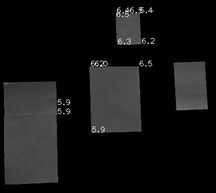
Figure 6: Distance predictions at 5 feet |
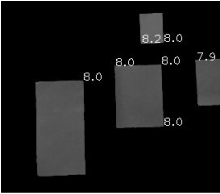
Figure 7: Distance predictions at 8 feet |
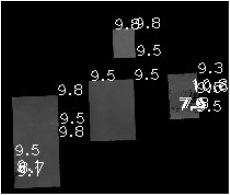
Figure 8: Distance predictions at 11 feet |
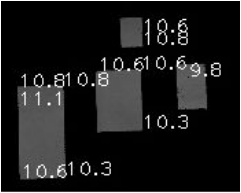
Figure 9: Distance predictions at 14 feet |
